engineering initiative · two takes, one thread · august 2026

The Frontend Diet

One problem, told two ways at once. The the report sections carry the engineering account — what the dashboard downloaded before first paint and the six steps that cut it by 94%. The the case study sections follow its strangest specimen through the same story: a 424 KB “vector” logo that was a photograph all along. The segmentation maps are live — hover anything; in the final map, click a chunk to open it.

the report

Executive summary

Every merchant visit previously began by downloading the entire application as a single 5.3 MB compressed file — 13.5 MB of JavaScript for the browser to parse — re-downloaded in full after every release, before the first screen could render. The application now loads in small pieces: a merchant downloads a ~300 KB core (only the design system they use) and then only the pages they open, each a chunk of typically 5–30 KB. The same work removed a sunset product surface, converted four decorative images that were secretly multi-hundred-kilobyte photographs into true vector graphics, fixed error monitoring for half our merchants, and cut production build times by two-thirds.

94%
smaller first-load download
(5,329 KB → ~303 KB)
−47%
total JavaScript shipped across all pages (5,626 → 2,999 KB gz)
951
independently cached chunks (was 48 assets, one 13.5 MB bundle)
faster production builds (3m 19s → 1m 5s), zero warnings (was 600+)
the report

What a merchant downloads before first paint

Compressed JavaScript a UX3 merchant downloads before their first screen renders, measured from production builds at each stage. The final figure is the measured boot path (entry 104 KB + shared vendor 41 KB + UX3 starter 35 KB + app configuration 123 KB); each page then adds its own 5–30 KB chunk on first visit. Classic-UI (UX2) merchants boot in ~298 KB by the same path.
the case study

Two ways to store a picture

A raster image (PNG, JPEG, a photo, a screenshot) is a grid of colored pixels. The file records the color of every dot, so its size depends on how many dots you exported — not on how simple the picture is. Zoom in and you see the squares; scale it up and it goes blurry, because there's no more information to reveal.

A vector image (SVG) is a set of drawing instructions — "a line from here to here, this curve, fill it purple." The file size depends on how complex the shape is, not how big it's drawn. The same file is pin-sharp at 16 pixels or on a billboard, and for flat artwork — logos, icons, illustrations — it's usually tiny.

Raster · a grid of pixels Stored dot by dot. Enlarged, the dots are all there is.
Vector · six coordinates Stored as one instruction: M7.5 0 L2 9 L5.5 9 L4 16 L10.5 6.5 L7 6.5 Z
The same bolt at the same zoom. The left version needs a stored value for every pixel; the right one is a single line of geometry that renders sharp at any size.
the case study

What we found in the app

Four of our "SVG" files weren't vectors at all. Someone (or a design tool) had exported a screenshot — a raster PNG — and wrapped it in an SVG file as an embedded image. The file has the right extension, imports cleanly, and renders correctly, so nothing ever complained. But each one carried the full pixel grid inside it, and two quirks of our build made it worse: each file was bundled twice (once per design-system icon folder), and embedded images are stored in a text encoding (base64) that our compression can't shrink — so they ride to the browser at nearly full weight while real code compresses to a quarter of its size.

FileDrawn atWasNow (true vector)
ux3-default-logo.svg25 px tall424 KB × 27.3 KB −98%
logo-white.svg25 px tall244 KB × 26.4 KB −97%
SparkleShoppingCart.vue80 px1,206 KB × 217.6 KB −99%
add-media-outlined.svg32 px19 KB × 22.1 KB −89%
The headline case: our logo, drawn 25 pixels tall in the sidebar, was a 424 KB file — roughly the weight of a paperback's worth of text, for a wordmark the size of this sentence.
the case study

Seeing is believing

This illustration is the actual replacement file, embedded right here in this page. It was a 1.2 MB screenshot; it is now 17 KB of geometry — the four flat colors traced into paths. Zoom your browser as far as it goes: it stays sharp.

the report

The segmentation maps

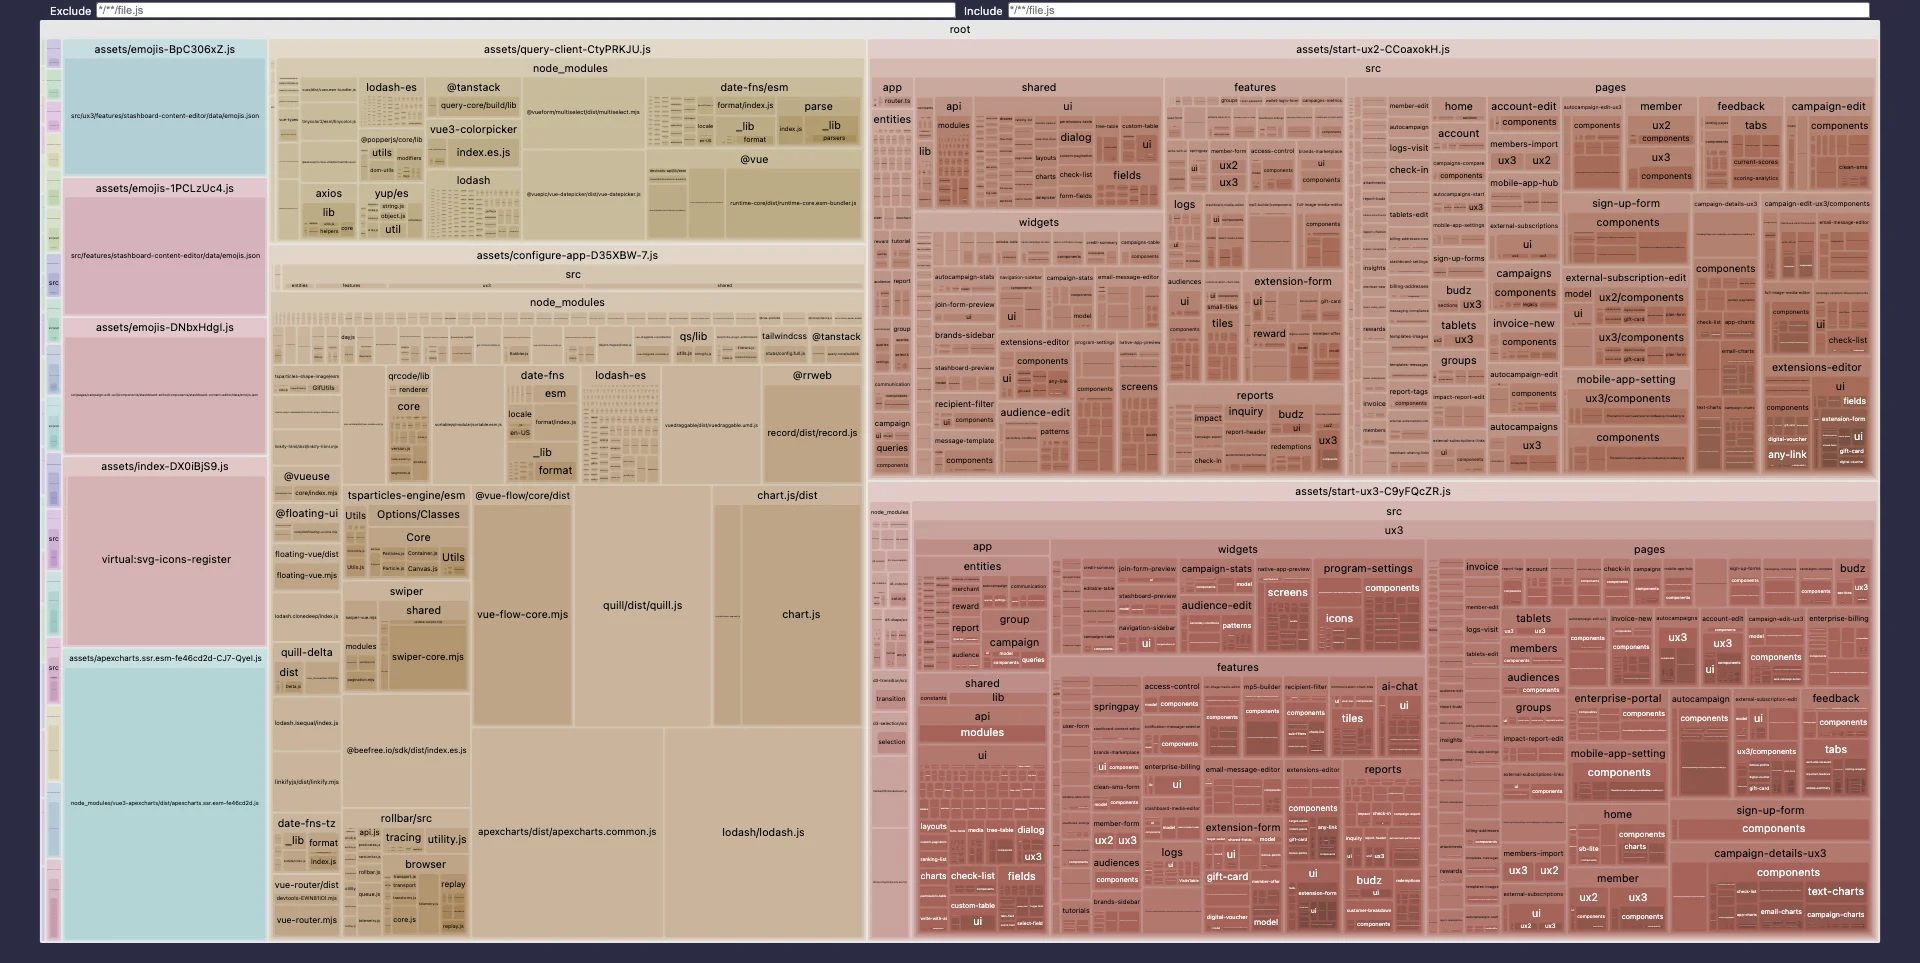
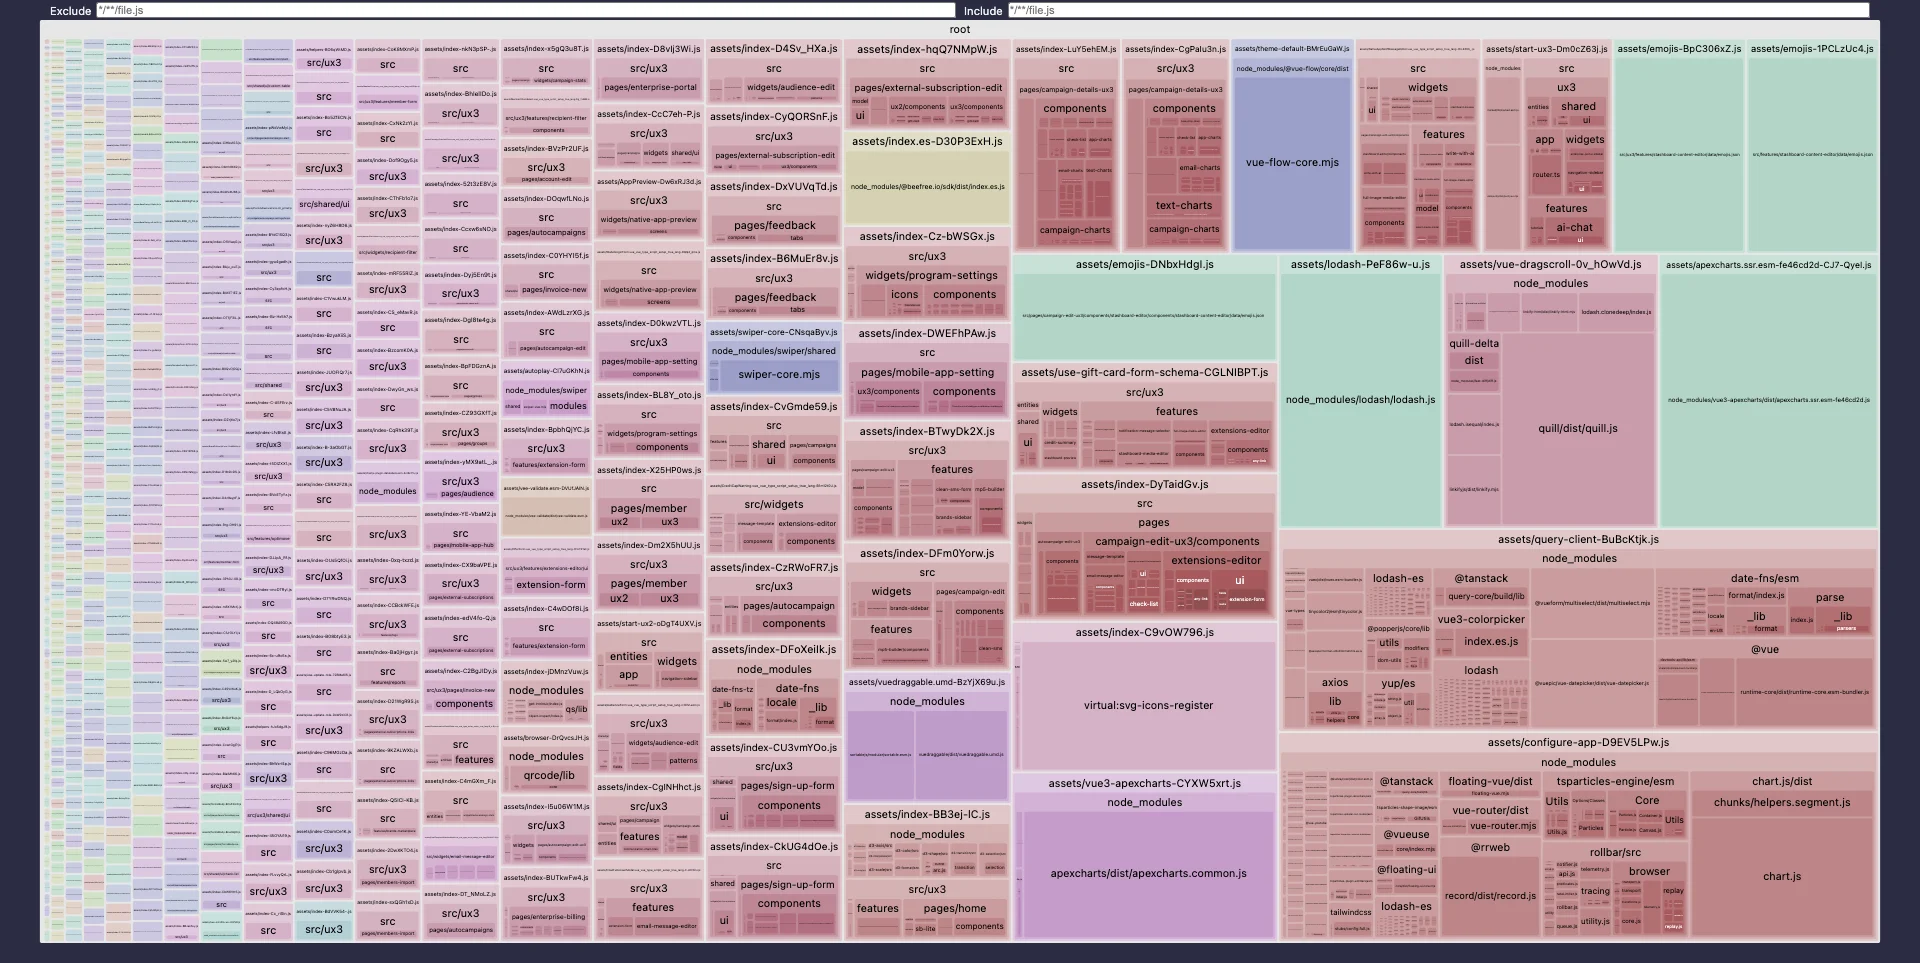
These treemaps are the build analyzer’s view of the deployed JavaScript — every rectangle is a module, every labeled region a file the browser downloads, area proportional to size. They are the clearest picture of what actually changed. The first two maps are reconstructed at block level from the analyzer’s measurements of those builds; the final map is the real module tree of the current build — 872 chunks, 5,619 modules. Hover for sizes; click a chunk in the final map to open it, click the breadcrumb to come back.

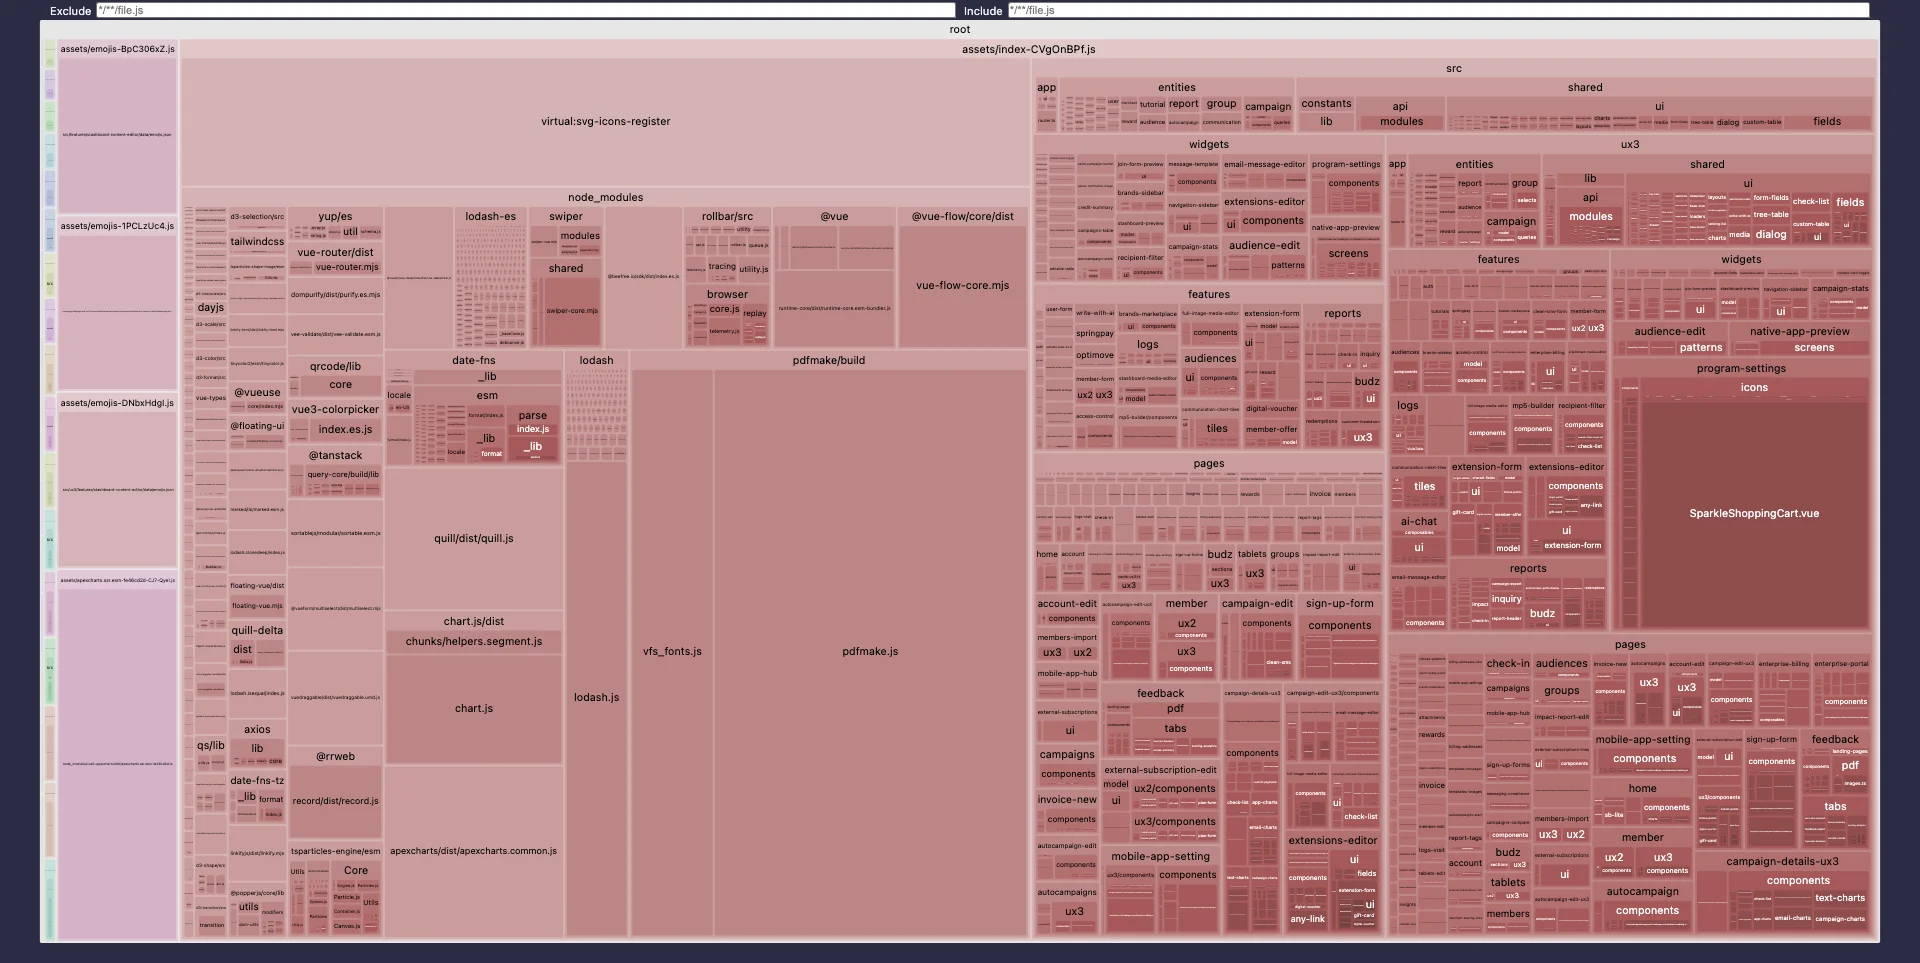
Baseline — the monolith. One file, index.js (13.5 MB parsed / 5.3 MB compressed), containing everything the product has ever needed: the PDF generator (pdfmake, the single largest block), two charting libraries doing the same job (chart.js and apexcharts), the rich-text editor, the entire icon sprite, three identical copies of a 550 KB emoji dataset, a 424 KB “logo” that was a photograph pasted inside an SVG wrapper, and both complete design-system trees (src and ux3) — although any given merchant can only ever use one of them. Every merchant downloaded all of it, on every visit after every release.
After the design-system split. The monolith is broken along its largest natural seam: start-ux2 and start-ux3 each carry one design system, configure-app carries the app-wide services both share, and query-client carries the shared vendor core. A tiny entry script now checks a locally cached preference and loads one of the two starters — a UX3 merchant never downloads a byte of UX2 again, and vice versa. The duplicated emoji datasets are already visible here as separate (and soon deduplicated) blocks.
After route-level splitting. The same codebase as hundreds of small, independently cached chunks: every one of the app’s ~250 routes became its own on-demand chunk, and heavyweight libraries (quill, chart.js, lodash, the drag-scroll and particle engines) sit in their own rectangles, loaded only by the pages that use them. A release now invalidates only the chunks whose code changed — typically tens of kilobytes — instead of the whole application. (This capture slightly predates the final cleanup; the apexcharts and feedback-page blocks visible here were subsequently deleted outright.)
the report

How the app is delivered now

The boot sequence is a deliberate chain of small decisions instead of one big download. The entry chunk reads a locally cached UX2/UX3 preference (falling back to a single API probe only when no session marker exists), dynamically imports exactly one starter, which pulls the shared configuration chunk and mounts. Everything else — every page, every heavy library — arrives on demand and is content-hashed for long-term caching. A guard on the router transparently reloads once if a deploy has replaced a chunk a long-lived tab tries to load.

Boot-path chunkRoleSize (gzip)
index.js (entry)router, session check, UX preference, chunk-reload guard104 KB
shared vendorVue runtime + query client, preloaded in parallel41 KB
start-ux3.js or start-ux2.jsone design system’s shell — never both35 / 31 KB
configure-app.jsAPI layer, tooltips, monitoring, app-wide services123 KB
first page chunkthe route being visited5–30 KB
the report

The steps, in order

1 — Retire the sunset surface−1,100 KB first load

The integrated feedback platform had been sunset as a product, but its code — the pdfmake PDF generator (the largest single block in the baseline map), a duplicate charting library (apexcharts), report-download plumbing, and eventually the entire feedback page with its entities and widgets — still shipped to every merchant. All of it was deleted: four dependencies and roughly 330 files, with old feedback bookmarks redirecting to the home dashboard. This alone took the bundle from 5,329 to 4,229 KB and, by shrinking the build’s memory footprint, ended the out-of-memory crashes that had been blocking releases.

2 — Split the two design systems−860 KB first load

The app contains two complete UIs — classic (UX2) and modern (UX3) — and every merchant was downloading both. The bootstrap was rebuilt: the UX preference is cached client-side, checked before anything loads, and revalidated in the background; each tree got its own starter chunk and its own API setup. The bundle became four macro-chunks (second map), and a merchant’s first load stopped paying for a design system they never see. This split also fixed a silent monitoring bug: UX2 crash reports had no release version attached, so Rollbar could never match them to source maps.

3 — Vectorize the “vector” images−904 KB total JS

Several decorative SVGs were photographs base64-embedded inside an SVG wrapper — including a 424 KB logo and a 758 KB shopping-cart illustration — and because they sat inside the icon sprite, they shipped as JavaScript to every merchant. Each was re-traced into a true vector (path outlines plus fitted gradients), typically 3–8 KB: a >98% reduction per image with no visible difference at any size.

4 — Load pages on demand48 → 933 assets

All ~250 routes across both trees were converted to dynamic imports, so the router fetches a page’s code the first time a merchant opens it. This is the change that turned the third map into a constellation: the download cost of a page moved from “everyone, always” to “only visitors, once per release that touches it.” A stale-chunk guard reloads the app once, transparently, if a tab left open across a deploy requests a chunk that no longer exists.

5 — Deduplicate and defer what remained−400 KB total JS

With the map finally legible, the remaining lumps were addressed individually: 219 icons that existed identically in both trees now ship once; the 550 KB emoji dataset that appeared three times ships once; chart.js registration moved out of the boot path into the 28 chart components that need it; the confetti/particle engine and the AI-chat panel load only at their moment of use; the date-picker and multi-select libraries left the boot shell. Total JavaScript across all chunks fell from 3,400 to 2,999 KB gzip.

6 — Make the build trustworthy600+ warnings → 0

The pipeline itself was part of the problem: builds took 3m 19s, crashed intermittently on memory, and emitted over 600 warnings — 623 circular-import warnings that could reorder module execution, plus deprecated style-compiler APIs — which meant real problems scrolled past unseen. Every circular import was resolved (a codemod fixed the barrel-file pattern causing them), the style pipeline moved to the modern compiler API with byte-identical output, memory was measured and right-sized, and source maps are now generated hidden, uploaded to the error monitor with a release version, and stripped from the deployed artifact. Builds finish in 1m 5s with completely clean output — a future warning will actually mean something.
the case study

Why it mattered

These files ship inside the application bundle, so every merchant downloaded them on every visit after every deploy — before the first screen could render. Together with the duplication, the four files accounted for about 2.6 MB of JavaScript payload. Fixing them (alongside related bundle work this week) helped take the app's first-load download from 5.3 MB to about 0.6 MB compressed — an 88% reduction. The vector versions also look better: crisp on high-DPI screens, and the icon now inherits theme colors, which a screenshot never can.

the case study

The bundle, before and after

These are treemaps of the compiled application — every rectangle is a file, sized by how many bytes it contributes to what merchants download. The dark, solid blocks are the rasters: solid because a screenshot is one indivisible blob, while real code breaks into hundreds of small modules.

source: original analyzer capture

Before. The entire app shipped as one 13.5 MB chunk. Note the large solid blocks: pdfmake/build (a PDF library plus its embedded fonts, kept for a sunset feature), the swollen svg-icons-register sprite carrying the raster logos, and the unmistakable SparkleShoppingCart.vue — a 1.2 MB screenshot rendered 80 pixels wide.

source: original analyzer capture · full visualizer output

After. The same application, now roughly 900 small files. The bundle splits by design system, every page loads its own code on first visit, the PDF library left with its sunset feature, and the raster blocks have collapsed into geometry too small to label. A merchant's first load went from 5.3 MB to about 0.6 MB compressed — they download the shell, then only the pages they actually open.
the case study

How this happens to reasonable people

No one chose this. Design tools offer "Export as SVG" on any layer — and if that layer is (or contains) a bitmap, the tool obligingly wraps the bitmap in SVG clothing without a warning. The file is an SVG, technically. The tell is the size: flat artwork as a true vector is almost never more than a few tens of kilobytes. A simple logo weighing hundreds is a screenshot wearing a costume — you can confirm it by opening the file and finding an <image> tag where the drawing instructions should be.

Numbers are from this week's build measurements on the frontend repo (chunk sizes before/after, compressed with gzip as served). The replacement vectors were traced from the shipped rasters and are visually identical at all rendered sizes; if the original vector sources still exist in the design files, exporting those would be strictly better still.

the report

What this means in practice

OutcomeBeforeAfter
First-load download (compressed)5,329 KB~303 KB −94%
JavaScript parsed at boot13.5 MB~1.0 MB
Est. transfer time, 5 Mbps connection~8.5 s~0.5 s
Total JS shipped across all pages (gzip)5,626 KB2,999 KB −47%
Largest single file (parsed)13,566 KB385 KB
Re-download after each releaseeverything, every merchantonly changed chunks typically tens of KB
Blocking API calls before first paint1 (every visit)0 (returning visits)
Production build3m 19s, OOM crashes, 600+ warnings1m 5s, clean −67%